Aerosols are everywhere in the atmosphere as small specks of solid particles or droplets suspended in the air. Even when the air looks clear and clean, everyday, each of us inhale millions of particles of aerosols.
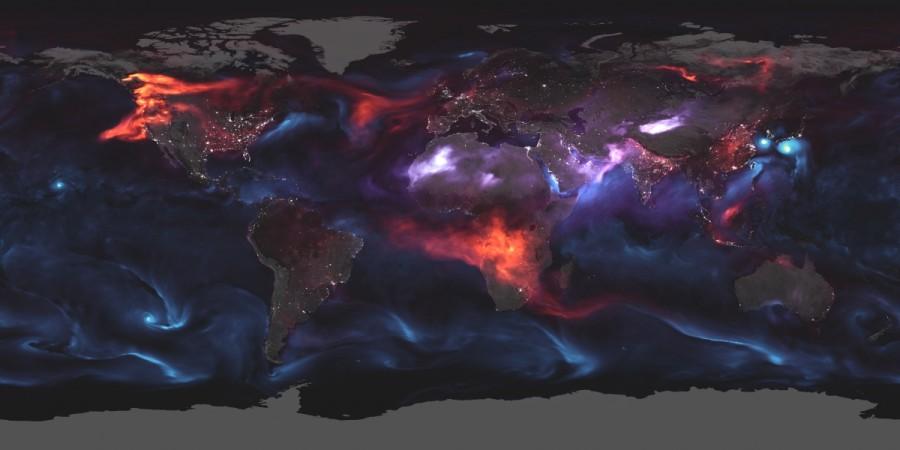
During extreme events like wildfires, the quantity of aerosols that get injected into the atmosphere increases significantly and with the right set of eyes in the sky it is possible to trace their journey around the world. NASA has released a new image that shows the extent of not only the US wildfires this year, but also how other aerosols from around the world travel from one place to another.
There is no environment in the planet where aerosols do not make an appearance, explains NASA. From oceans to deserts and mountains to ice, every ecosystem is filled with them. They are fairly easy to spot in certain places. The mist near waterfalls, fog, vapour over fires—all of them are aerosols. NASA, on the other hand takes a different view of things.
Looking down from space are Earth-observing satellites like the Terra, Aqua, Aura and Suomi NPP, which come together and create the Goddard Earth Observing System Forward Processing (GEOS FP), that gives a clearer view of the different particles in the air.
The image above is the GEOS FP model's result for aerosol concentrations around the world as of 23 August 2018, says NASA. During this time, huge plumes of smoke from fires drifted all over North America and spread out up to Africa. At the same time, three completely different tropical cyclones raged out in the Pacific Ocean, while clouds of dust blew over African and Asian deserts, notes the space agency.
The storms in the ocean are sea salt aerosols seen as giant blue swirls, swift winds carry them high into the air as sea spray, explains the report. Black carbon particles are marked red in the map and are among the solids that are emitted by fires. Other sources of carbon in the air is vehicle and factory pollution. Dust particles are shown in shades of purple.
Along with the aerosols in the atmosphere, this visualization also includes layers of night light data, notes the report. It was reportedly collected by the day-night band of the Visible Infrared Imaging Radiometer Suite (VIIRS) on Suomi NPP. It pinpoints the locations of major towns and cities.


!['Had denied Housefull franchise as they wanted me to wear a bikini': Tia Bajpai on turning down bold scripts [Exclusive]](https://data1.ibtimes.co.in/en/full/806605/had-denied-housefull-franchise-they-wanted-me-wear-bikini-tia-bajpai-turning-down-bold.png?w=220&h=138)
![Nayanthara and Dhanush ignore each other as they attend wedding amid feud over Nayanthara's Netflix documentary row [Watch]](https://data1.ibtimes.co.in/en/full/806599/nayanthara-dhanush-ignore-each-other-they-attend-wedding-amid-feud-over-nayantharas-netflix.jpg?w=220&h=138)


