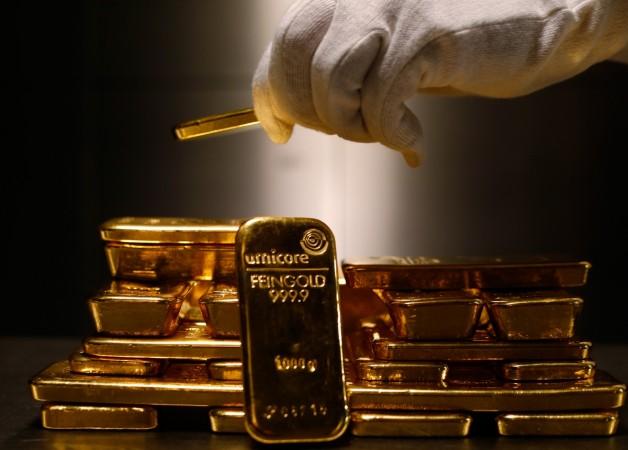
Gold has lost its year to date gains post Friday's blockbuster US jobs data.
The headline US unemployment rate came in at 5.9% - the last time the unemployment rate was below 6% was in July 2008.
The US economy added 248,000 jobs in September, which marked the 48th straight month of job creation. This was sufficient news flow for traders to push back the price of the precious metal below $1,200/ounce as the probability of an earlier than expected rate hike by the Fed looks likely.
After tumbling by as much as 28% last year, if gold keeps inching downwards in the fourth quarter, it would be the first back to back year of losses since the great bull-run begun in 1998.
This column has been bearish on gold since price levels of around $1525/ounce when Ben Bernanke first announced the tapering of the Quantitative Easing (QE) program. The US ten year yields climbed to 3% by 2013 end and gold accordingly corrected to levels of $1,200/ounce. This was due to the fact that the market was expecting higher real interest rates going forward.
As we have written before, the real interest rate captures the opportunity cost of holding gold relative to other risk-free assets which provide a return. Thus, historically, one of the most common reasons to have held gold was low real interest rates.
The bull market of the 1970s, early 1980s and the previous decade up to 2013 were all associated with negative US real interest rates. Further, the fall in gold prices from 1982 to 2001 was associated with a prevailing period of rising and high real interest rate environment.
However, what's interesting now is the fact that gold is back to its starting point of 2014 even though QE will be completely tapered off by November. The US 10 year yields remain below 2.5% due to the ultra dovish stance of Janet Yellen. Thus, gold is trading at the same price level as it was in early January this year when QE taper had just begun and US 10 year yields were north of 3%.
Further, the price of gold does not seem to be pricing in the geopolitical tensions around the globe as improving the US economic data has completely overshadowed other variables, which would act as catalysts to drive the yellow metals price higher.
The US Dollar Index has gained almost 7% this year, and is currently quoting at its highest level since June 2010. A stronger greenback implies weaker commodities. Thus, at $1,200/ounce, this column suspects that rising the US yields and a potential Dollar bull market has been priced in already.
As price momentum is strongly towards the downside, one should not rule out a further fall of another $100/ounce. At those levels, this column suspects gold becomes a high conviction long trade. One major theme which might play out is that the US economic recovery may falter. If this is the case, the US Fed will be on the back foot and might have to retrace its forward guidance.
Already, we have seen a huge divergence in the US stock performance. Although, the S&P 500 has scaled to record highs, mid-cap and small-cap indexes have underperformed. (In fact, their returns have been in the red)
The Russell 2000 Index is down 10% from its high in March. NYSE stock margin debt is again at record highs last seen only in late 2007. Much of the rally in US stocks has as much to do with share buybacks as earnings upgrades. Thus, the fact remains that the US equity market is vulnerable to a deep correction and that undoubtedly money will flow back into gold if there is a global risk off move again.
Gold bugs should not go all in and bottom fish at current levels as a further drop of about $100/ounce seems likely looking at momentum indicators. However, the time to start accumulating gold again has arrived. This column expects it to be trading at $1,500/ounce in 2-3 years.


